Climate TRACE Data Show Global Greenhouse Gas Emissions Hit a New Record High in 2025
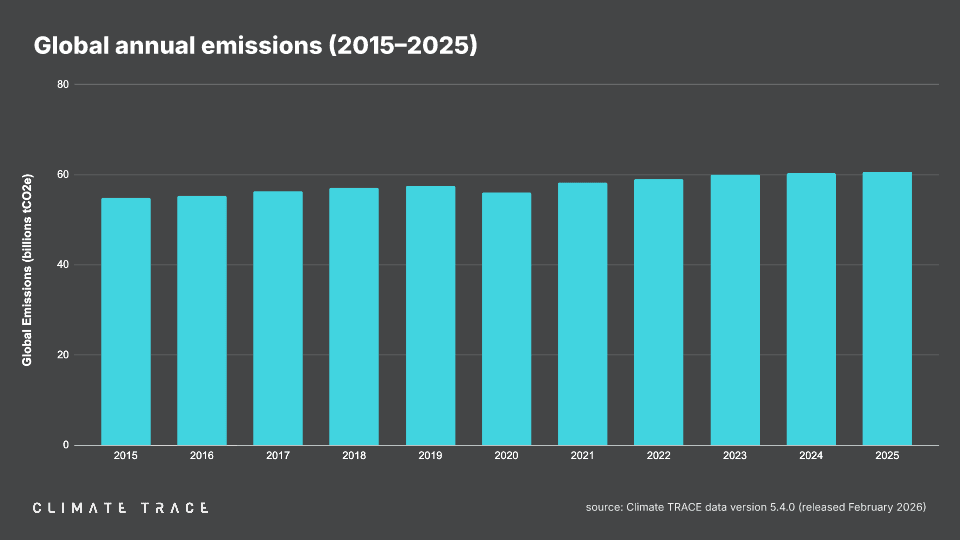
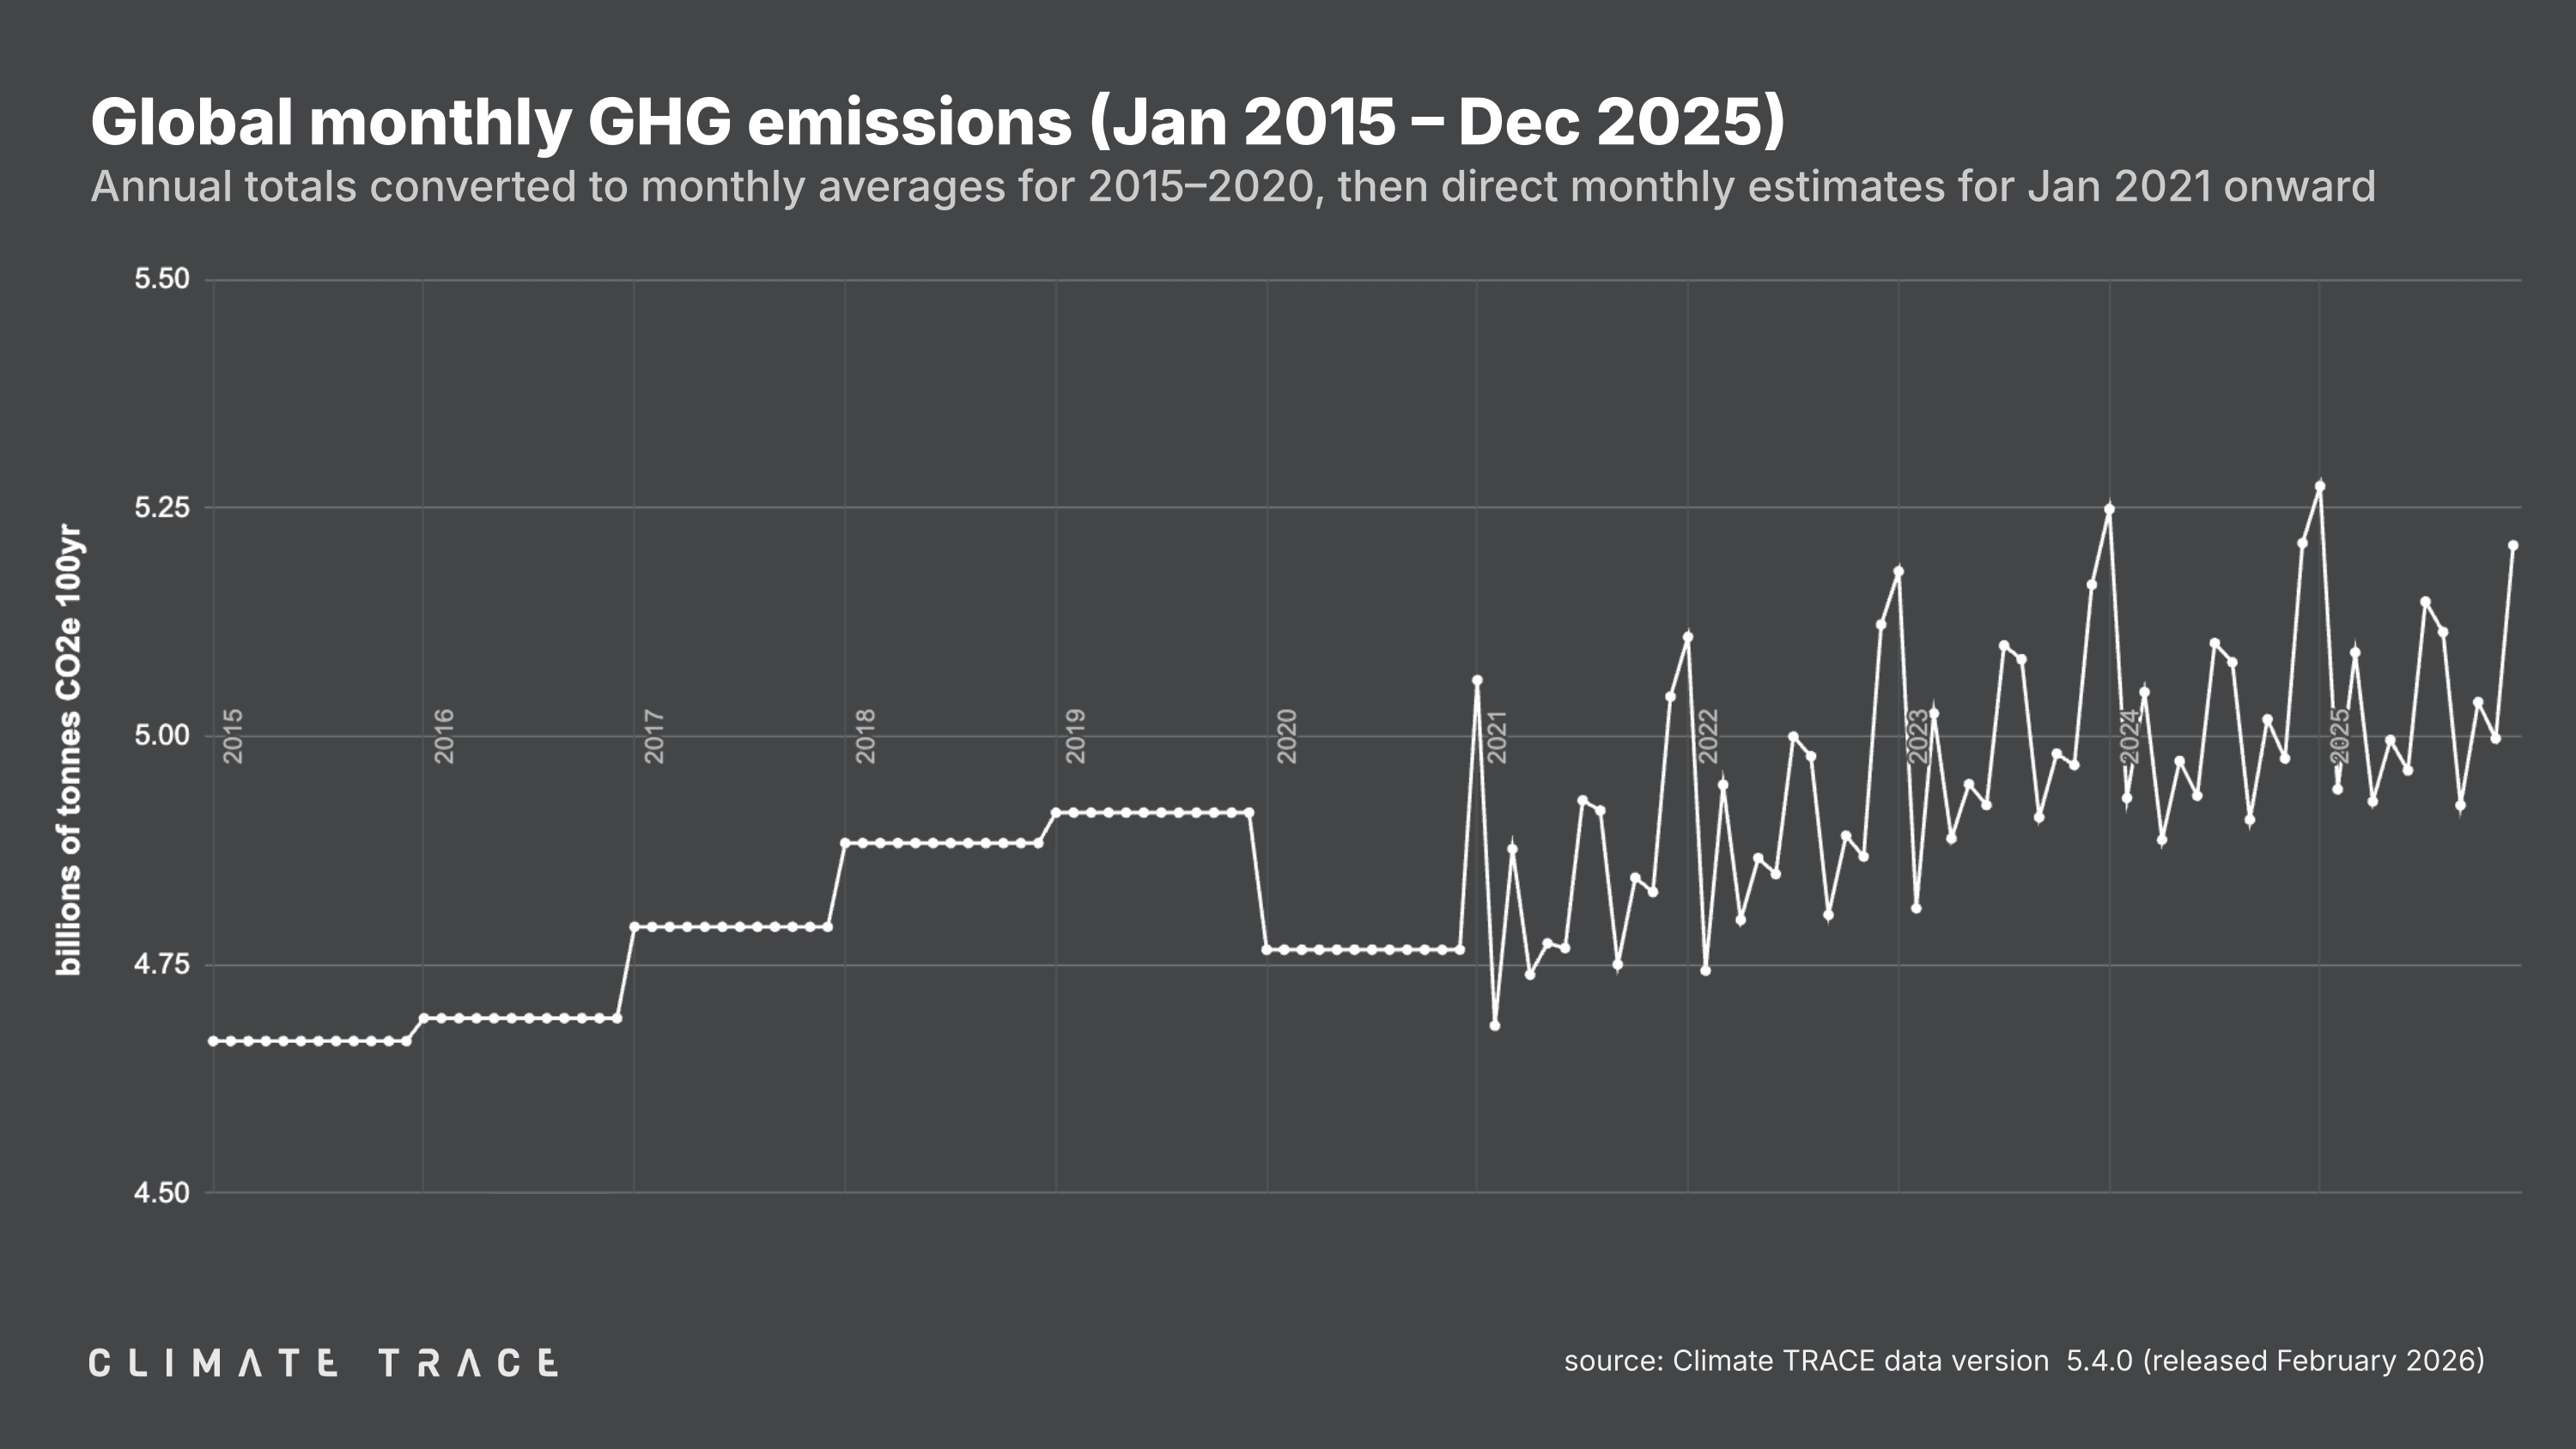
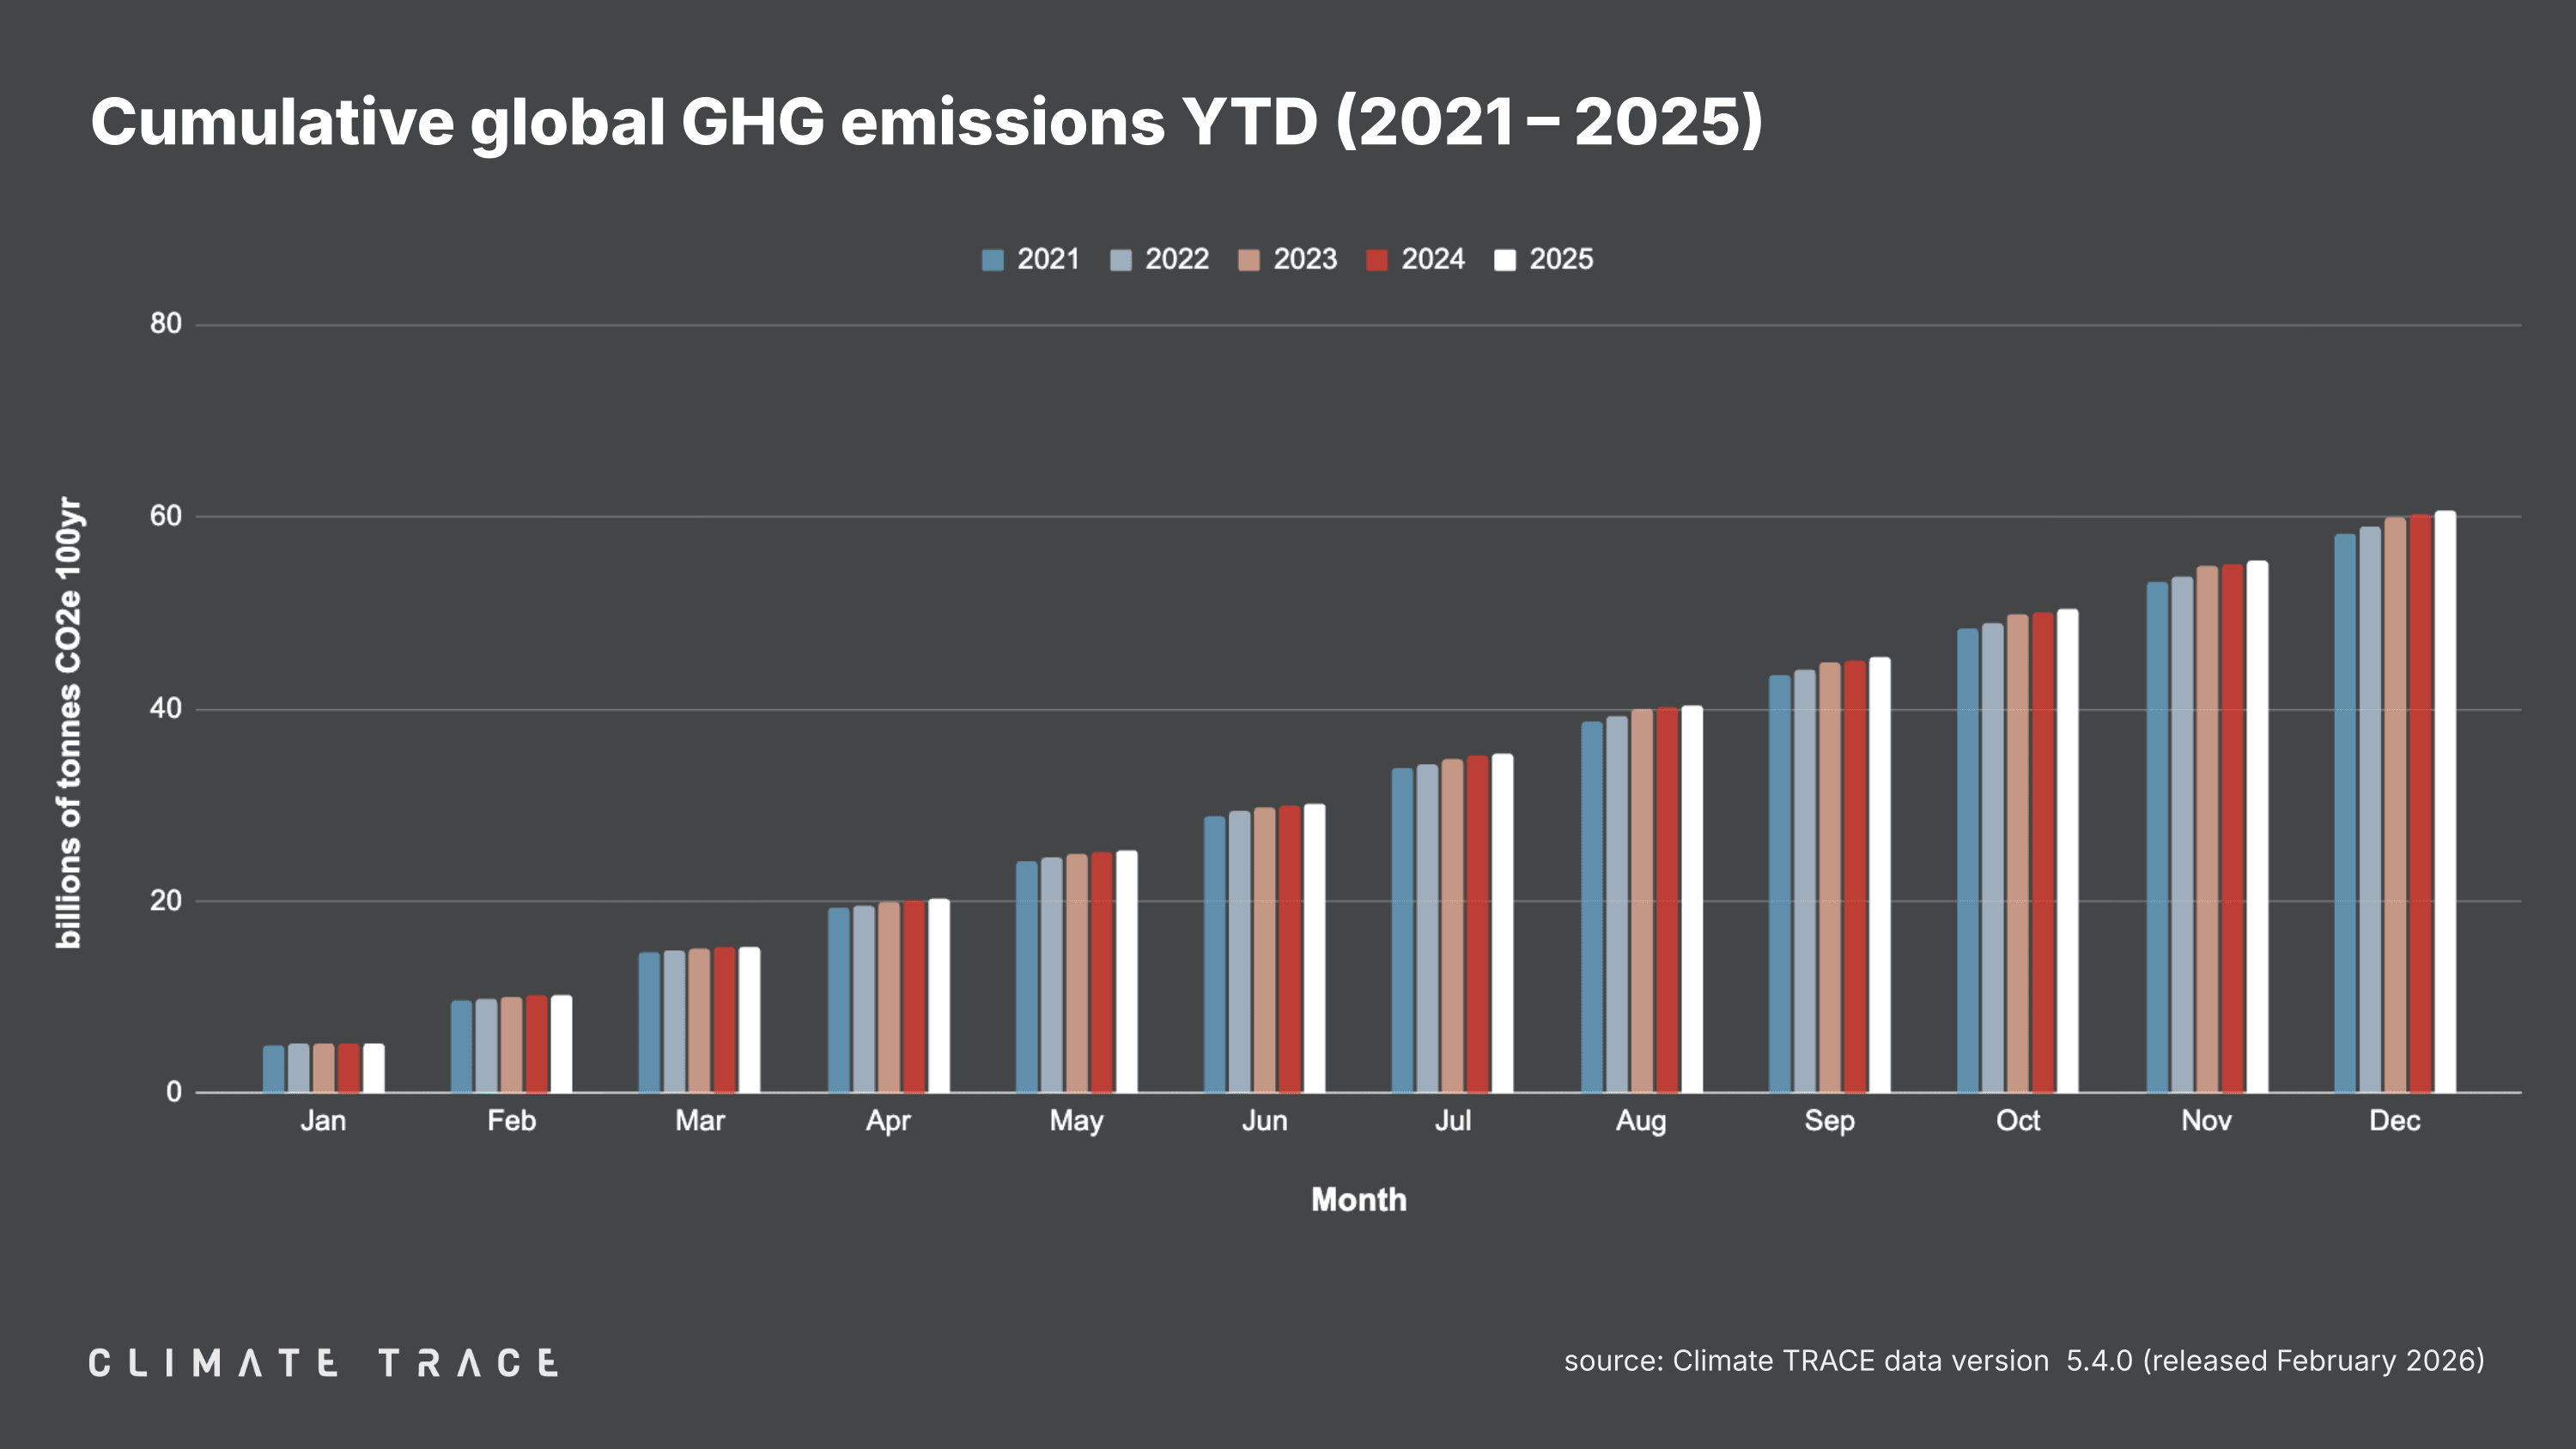
February 26, 2026 -- Today, Climate TRACE released full-year 2025 emissions data, showing that global greenhouse gas (GHG) emissions increased 0.50% by 303.19 Mt CO2e last year, reaching a new high of 60.63 Bt CO₂e. Global methane emissions increased 1.03% or 4.2 Mt CH4 in 2025, rebounding from a decline in 2024 to set a new annual record of 412.59 Mt CH4, surpassing the previous record set in 2023.
Key Insights from 2025 Emissions Data:
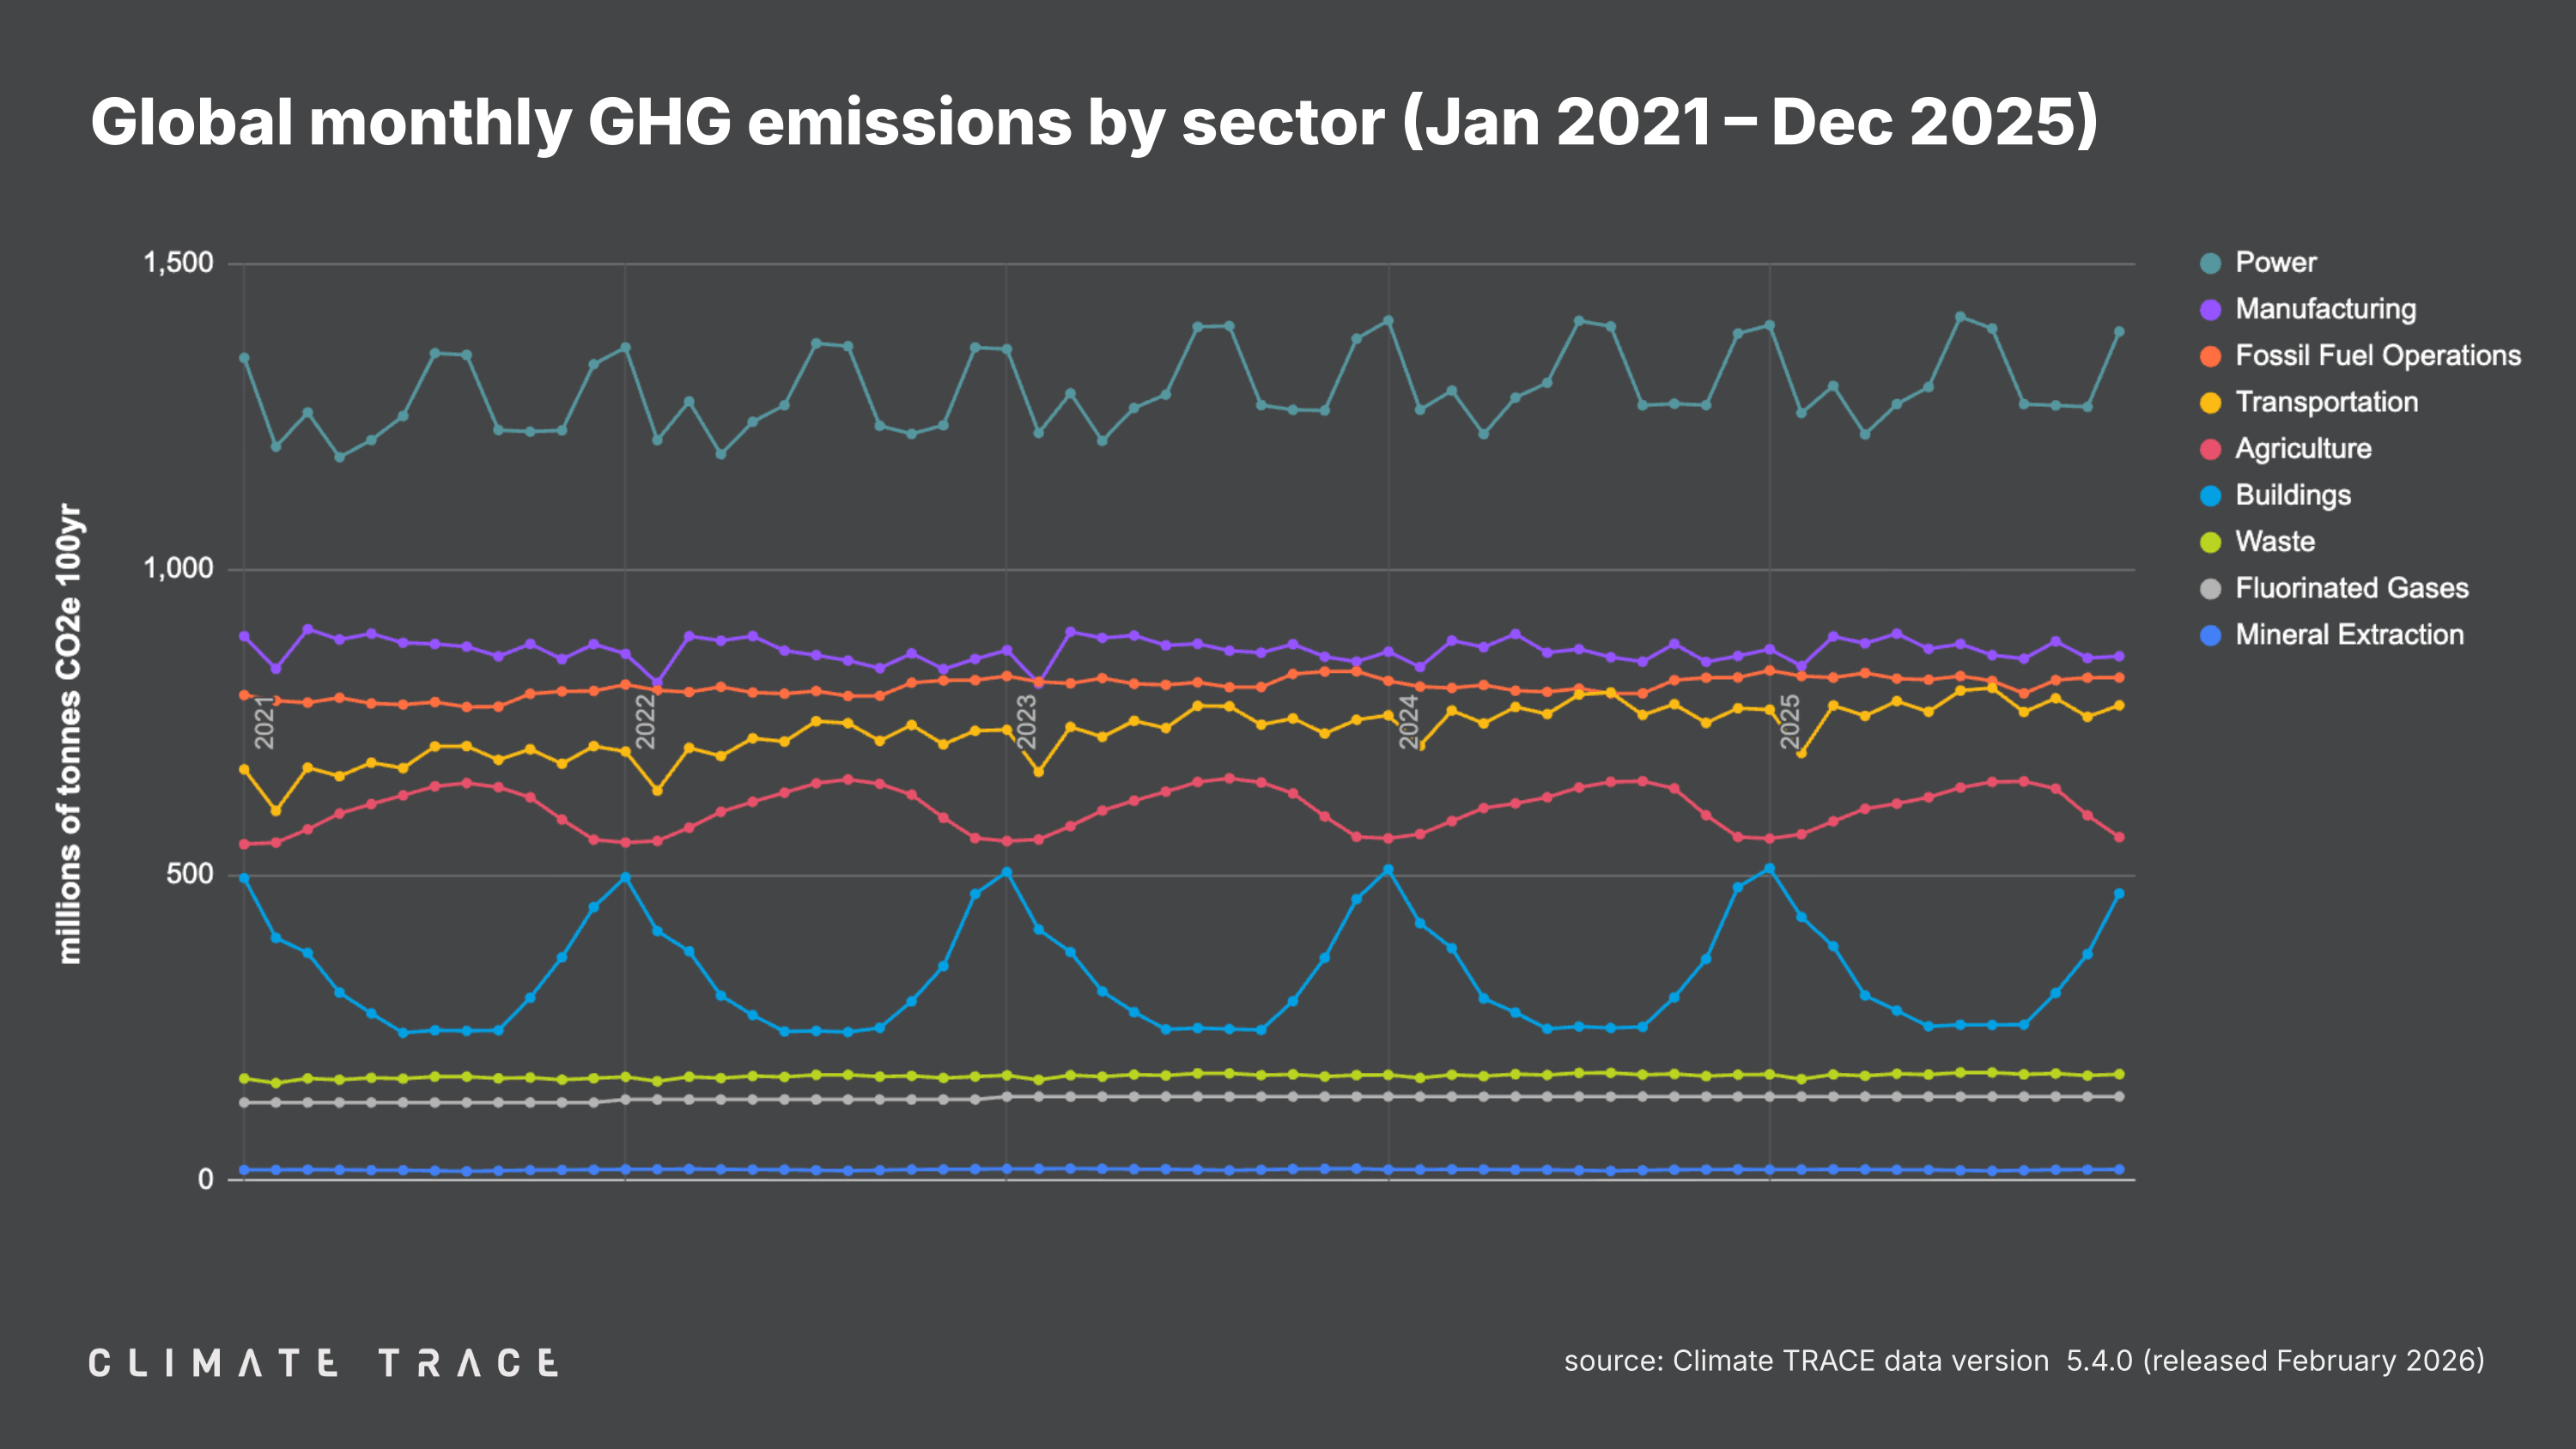
- Despite a small decline in power sector emissions, fossil fuel operations, transportation, manufacturing, and buildings all nudged global greenhouse gas emissions higher.
- Oil and gas production was the subsector with the largest jump in emissions, increasing 4.1%.
- The biggest movers in the power sector were China, India, and the US. For the first time since at least 2015, emissions from China's power sector decreased year over year, but that decline was offset by an equivalent increase in US power emissions. Meanwhile, India's power sector emissions fell for the first time since 2020.
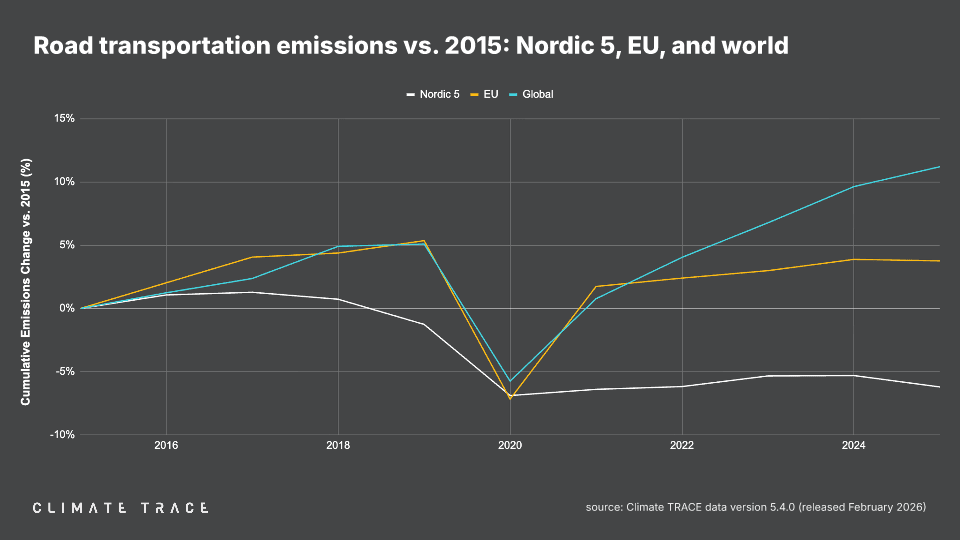
- Road transportation emissions increased globally, but have dropped in Nordic countries where electric vehicle (EV) adoption is high.
All 2025 emissions data --- which include monthly and annual totals for all major greenhouse gases and eight major non-GHG co-pollutants across 10 sectors, 64 subsectors, every country, state/province, county, more than 9,000 cities, and more than 744 million individual assets --- are now publicly available at ClimateTRACE.org. The analysis below focuses on non-land use, land-use change, and forestry (LULUCF) emissions --- full LULUCF data are available on our website. Data highlights for the month of December 2025 are also included below.
Global Trends
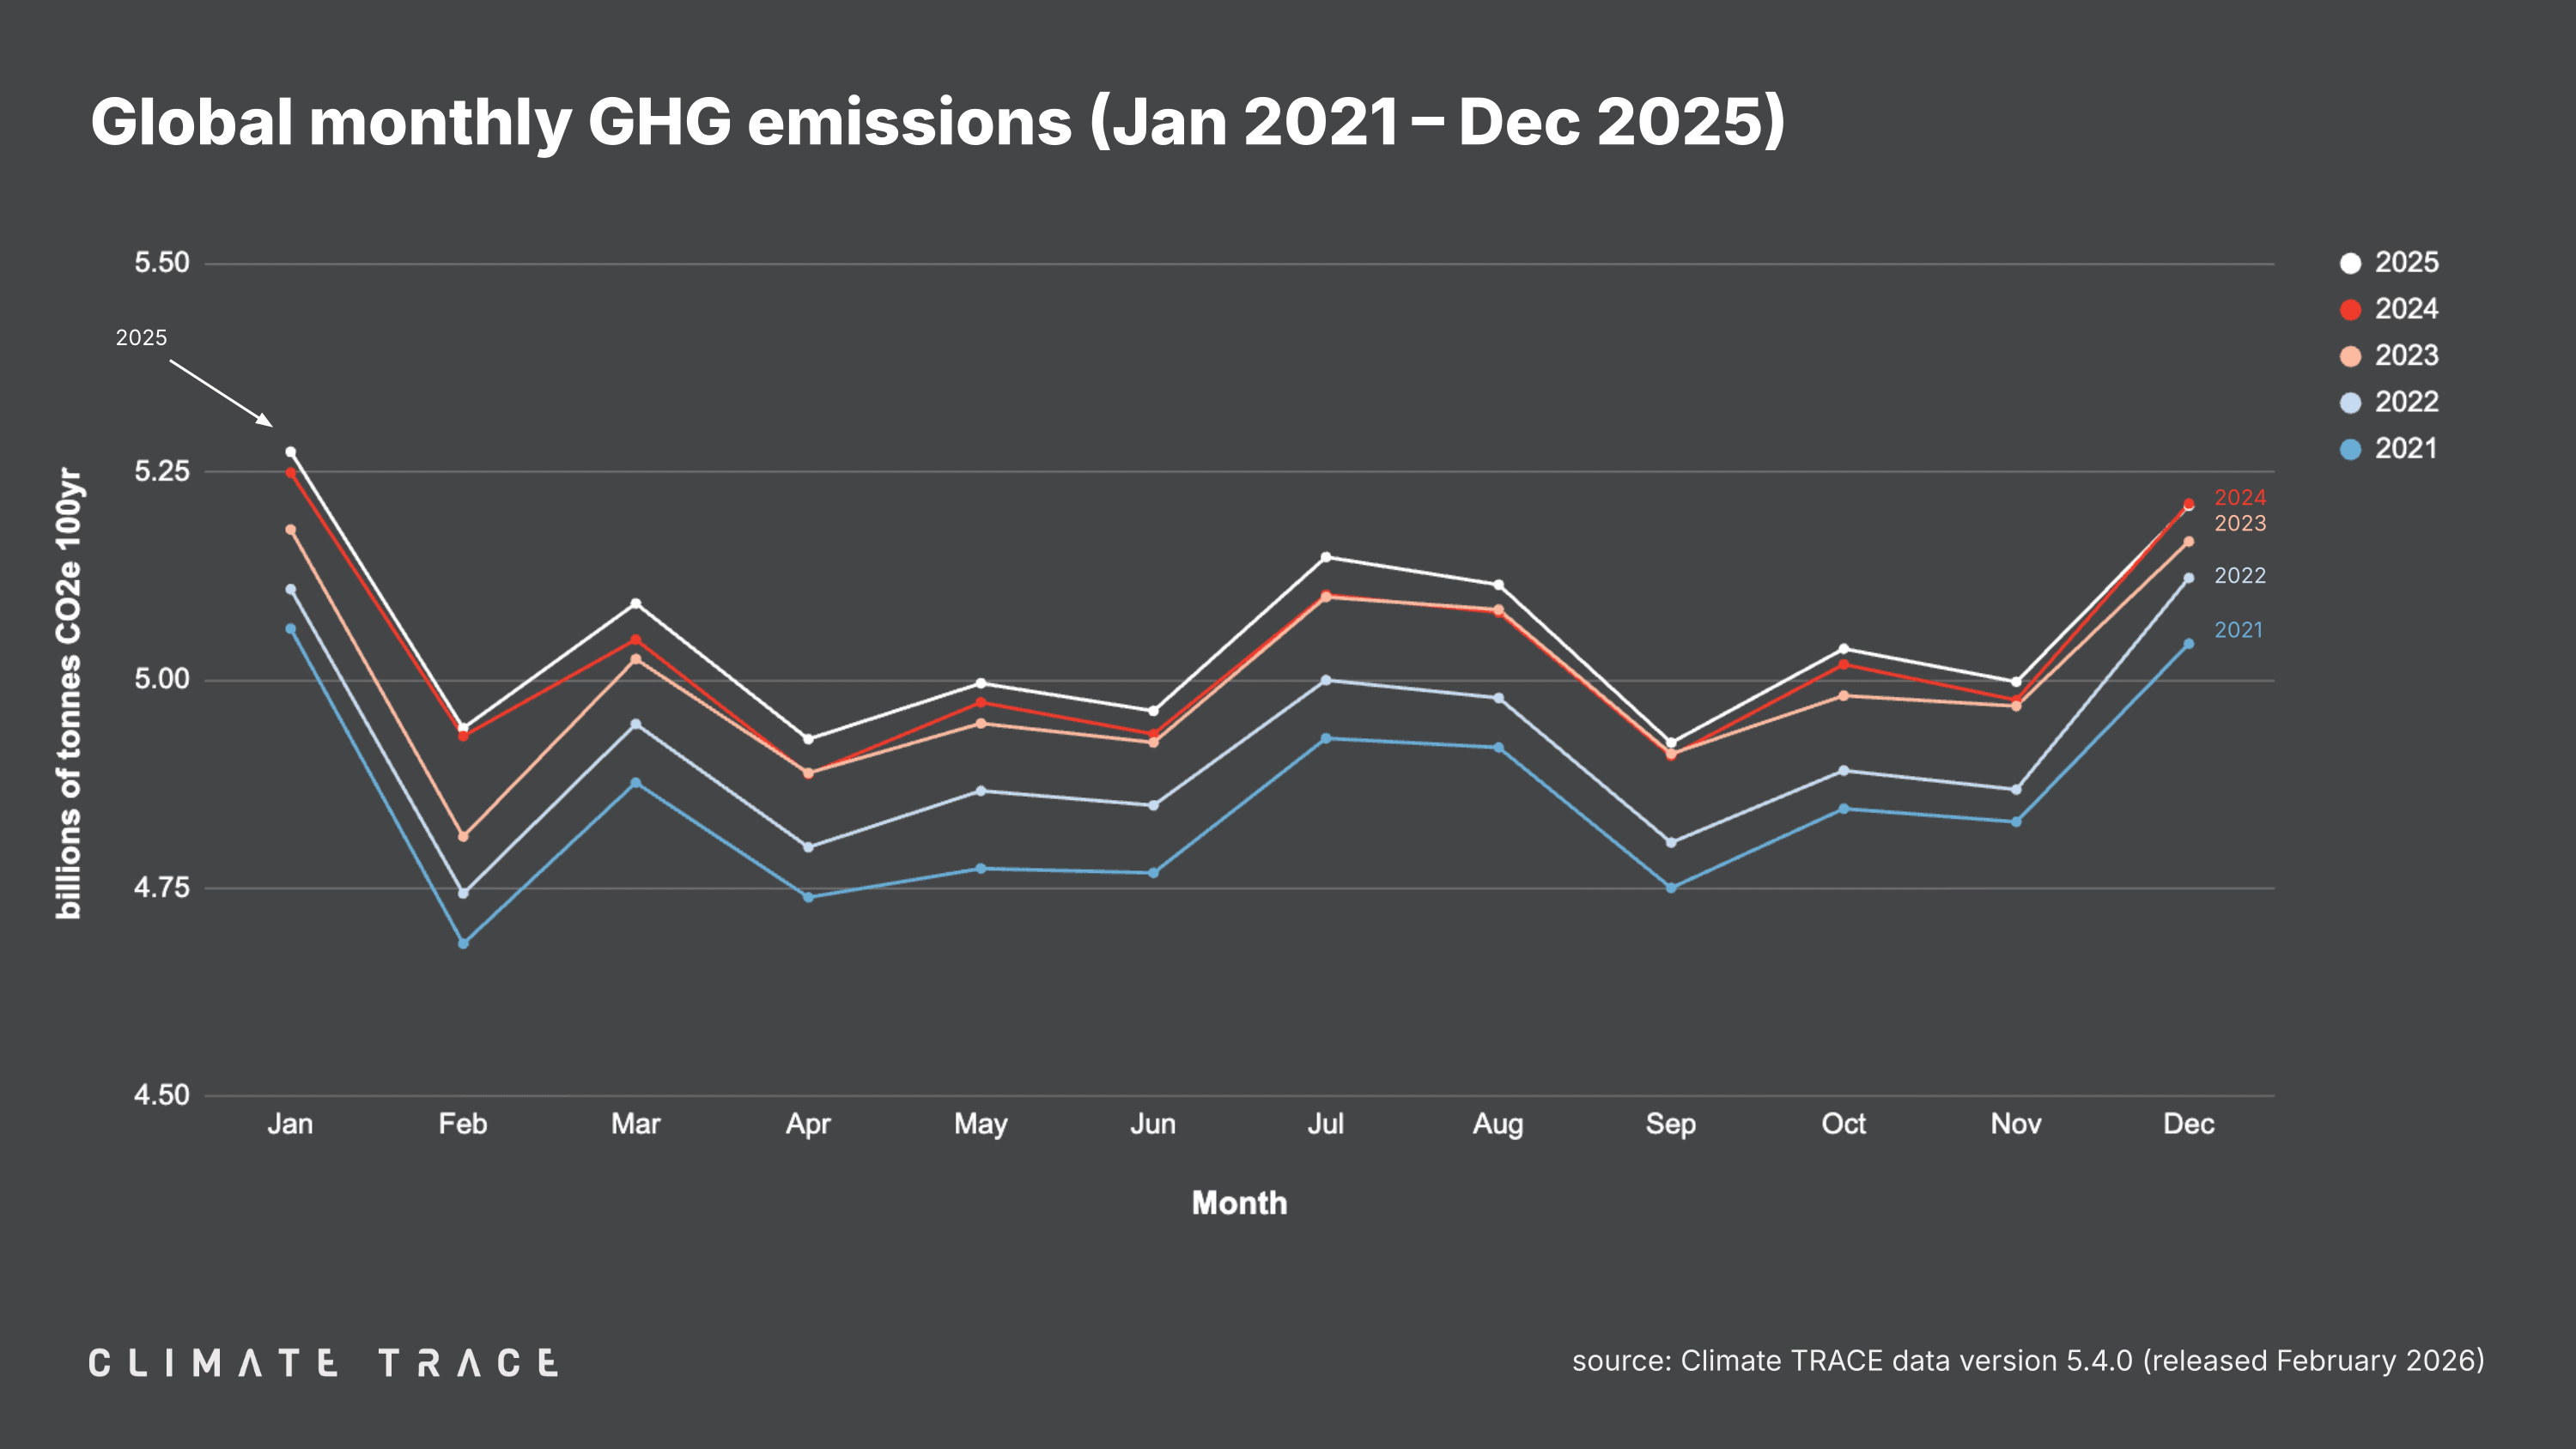
Climate TRACE data show that in nearly every month of 2025, global emissions were higher than they were in 2024.
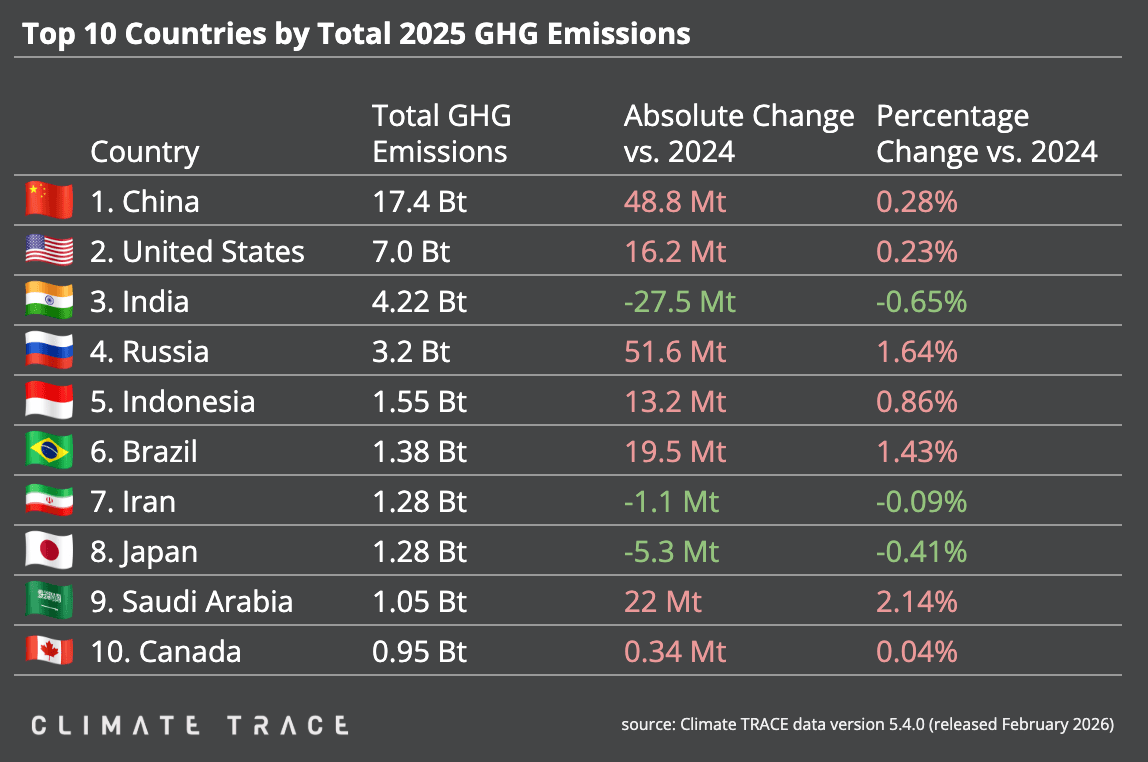
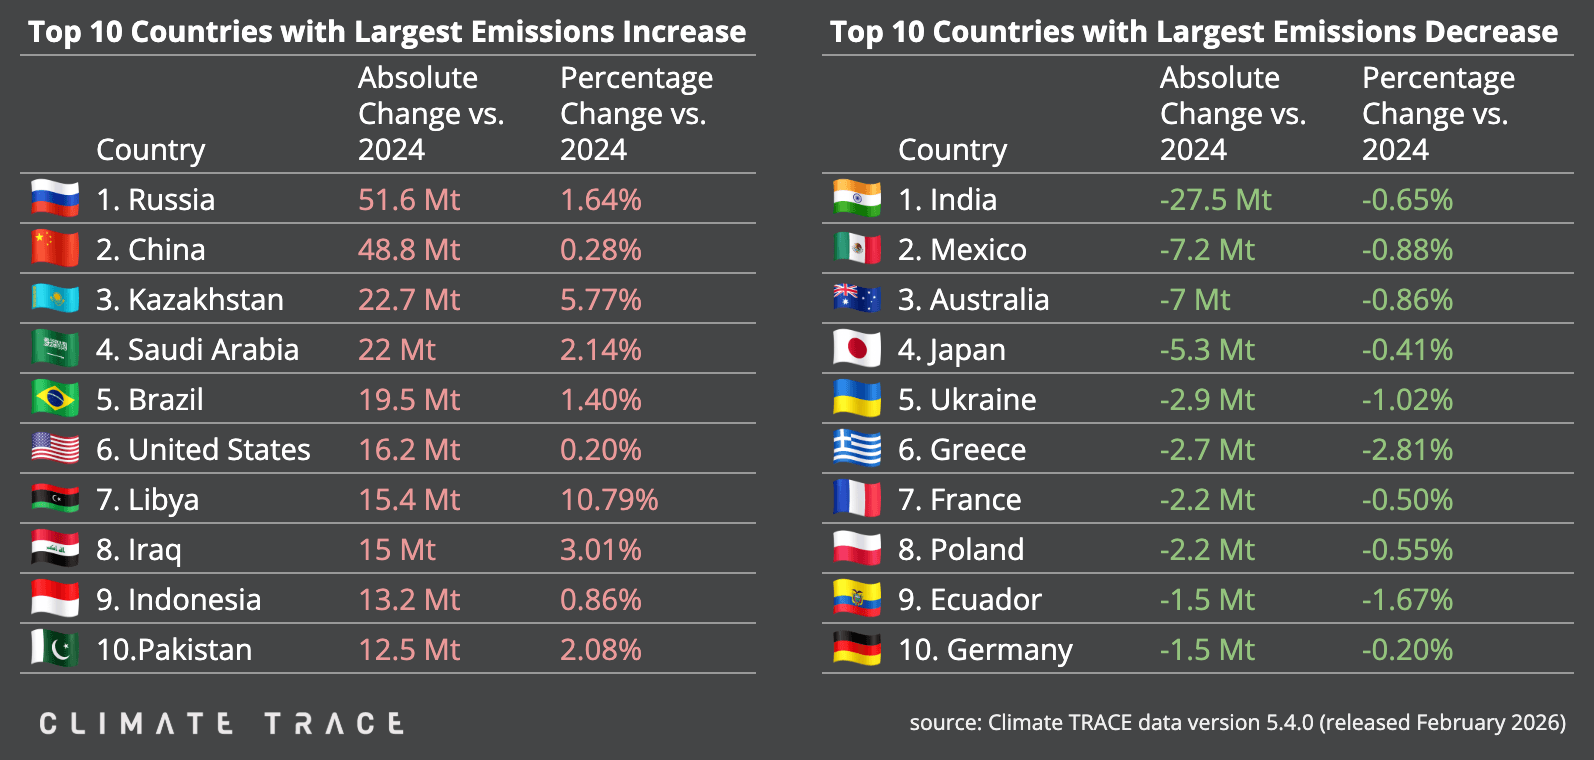
In 2025, Russia's emissions increased the most of any country in the world, while India had the largest drop in emissions. China and the United States, the world's top two emitters, saw their emissions stay relatively flat in 2025, ticking up slightly in each country. Despite the relatively small rate of increase, China and the US ranked second and sixth, respectively, for largest increase in absolute emissions.
Across 10 major emitting sectors, the most significant growth in emissions in 2025 came from fossil fuel operations, with emissions rising 1.56% or 151.57 Mt CO2e. Emissions also rose in the transportation, manufacturing, and buildings sectors last year.
The power sector continues to be the largest source of global emissions in 2025 (26% of total emissions). Climate TRACE data show that global power sector emissions fell slightly, decreasing by 0.13% or 20.31 Mt CO2e in 2025 --- the first decline since the COVID-19 pandemic. Most of the decline came from electricity generation in India and China (more on this in the section on clean energy uptake below), but Russia, Australia, and Poland also saw significant drops in their power sector emissions.
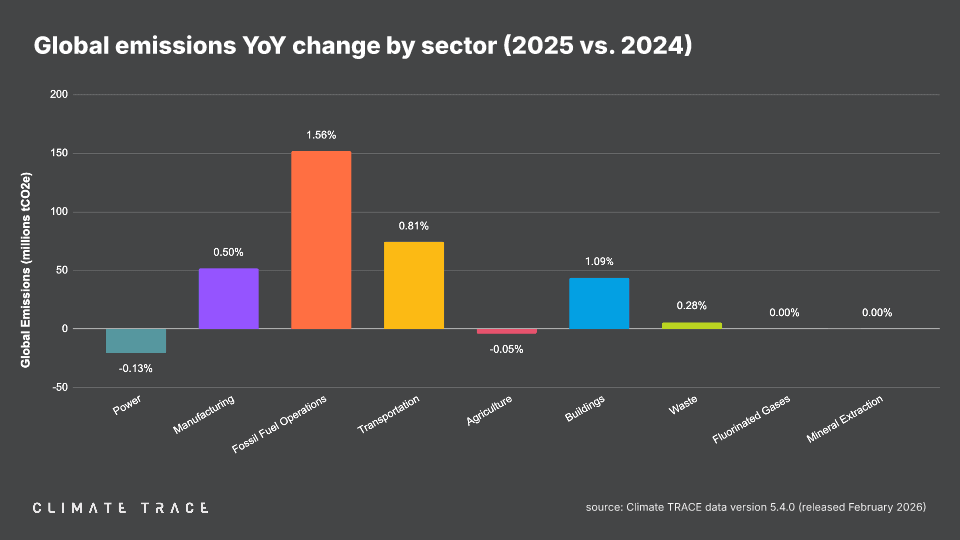
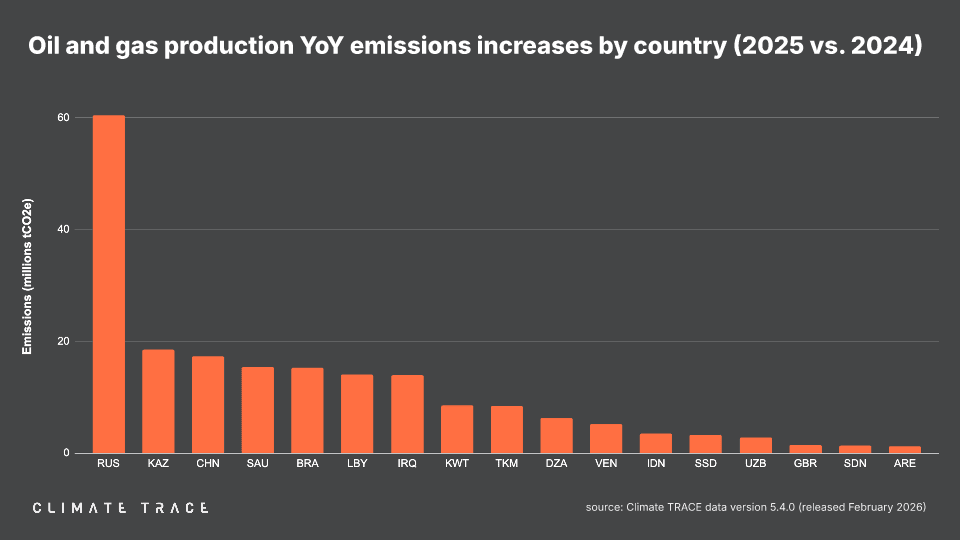
Much of the emissions increase in fossil fuel operations came from higher oil and gas production emissions, which rose 4.1% or 163.2 Mt CO2e in 2025. This was the largest increase in emissions among the 64 subsectors tracked by Climate TRACE. Russia's oil and gas production emissions were responsible for the majority of that increase, though other countries including Kazakhstan, China, Saudi Arabia, and Brazil also saw increases in emissions from oil and gas production last year. In fact, Brazil's oil and gas production emissions increased 29.0% last year.
Globally, the current rate of growth in emissions is half of what it was throughout the rest of the decade, slowing from an average 1.1% increase each year between 2015 and 2023 to an average of 0.5% increase over the past two years. Excluding 2020, the past two years saw the slowest growth in emissions since 2015, the year of the Paris Agreement.
Spotlight on China and the US
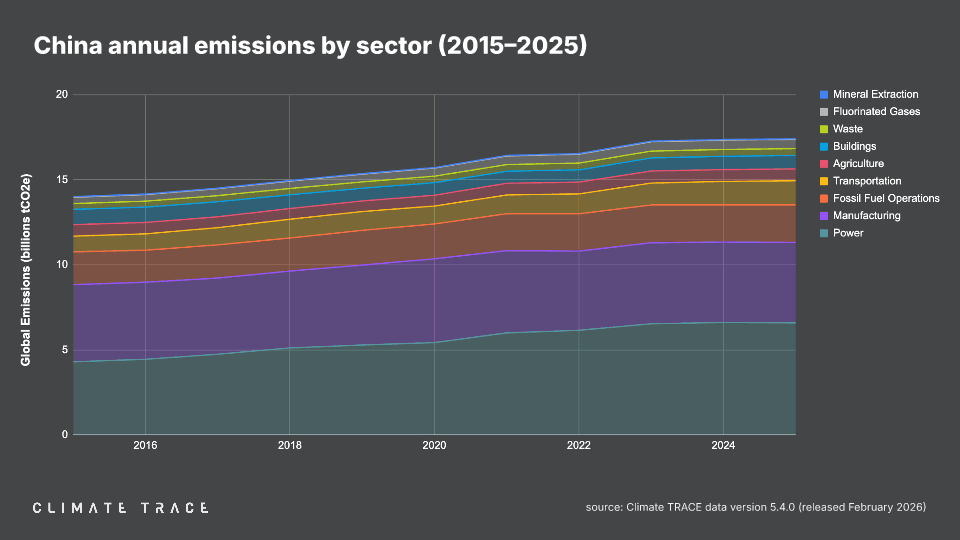
China and the United States continue to be the first and second largest sources of emissions, by country.
China's greenhouse gas emissions have been steadily increasing over the past decade, but the rate of increase has slowed. Between 2015 and 2023, China's emissions grew by an average of 2.66% per year. But for the past two years, China's emissions have grown less than 1% each year. In 2025, China's emissions rose by only 0.28%, the smallest increase of any year in the Climate TRACE database, which extends back to 2015. 2024 saw the second smallest increase in that period, when emissions increased only 0.52%.
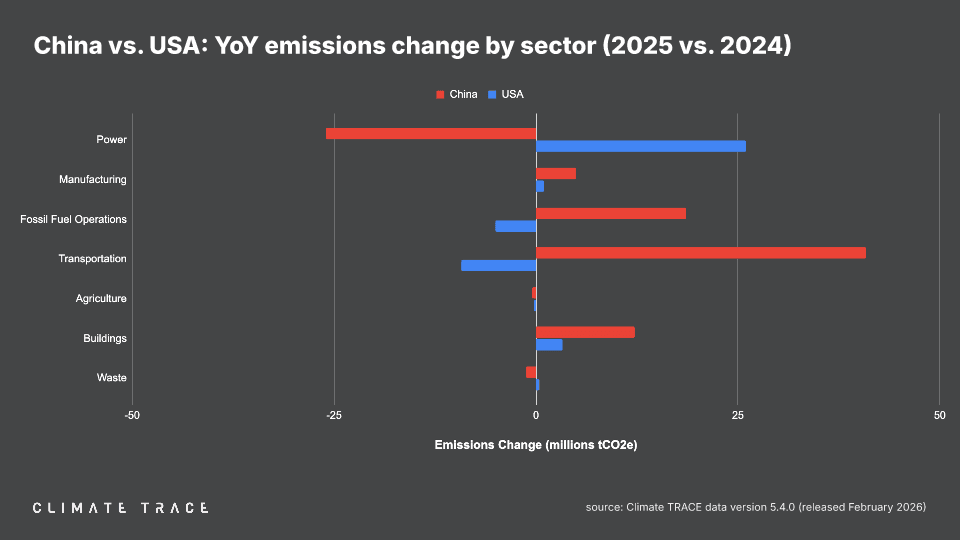
For the first time since Climate TRACE began tracking emissions, China's power sector emissions fell in 2025, dropping 0.39% or 25.99 Mt CO2e. Ultimately, the small decline in emissions in the power sector was offset by increases across other sectors, particularly road transportation, which had a 4.76% or 48.7 Mt CO2e increase in 2025.
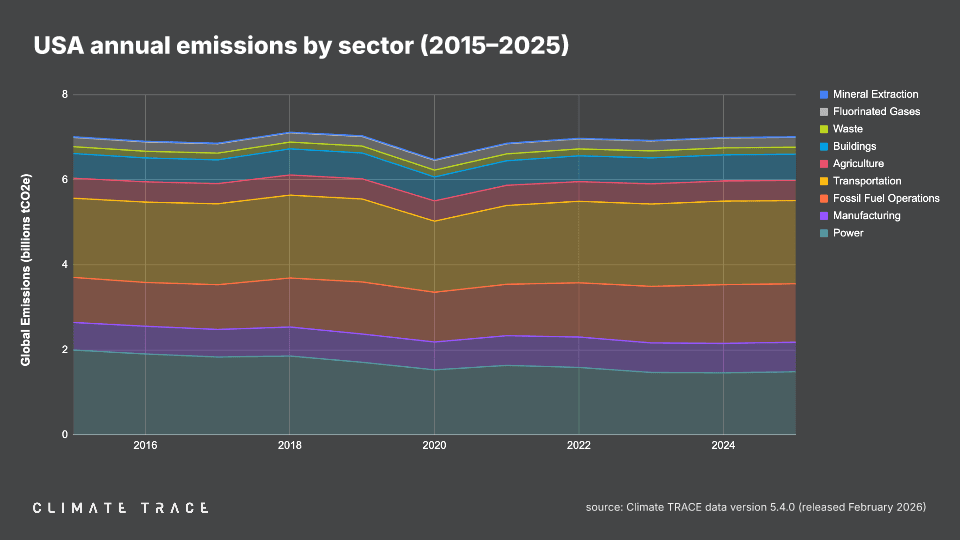
Despite some annual fluctuations --- particularly the drop in emissions due to the COVID-19 pandemic and subsequent rebound --- US emissions have remained roughly flat over the past decade. In 2025, US emissions totaled 7.01 Mt CO2e, nearly what they were in 2015, the year of the Paris Agreement, when they were 7.04 Mt CO2e. In the US, power and fossil fuel operations are following opposite trajectories, with power emissions falling 25.5% since 2015 and fossil fuel emissions increasing 29.8% in the same time. However, in 2025, each sector bucked these trends. Last year, the US power sector saw its second largest increase in emissions in the past decade (the largest was the post-pandemic rebound in 2021), an increase of nearly 1.8% or 26 Mt CO2e. Meanwhile, fossil fuel operations fell marginally by 0.36% or 5 Mt CO2e.
It is notable that the decline in power sector emissions in China was roughly equal to the increase of power sector emissions in the United States in 2025, effectively canceling out any net impact.
Where Clean Energy Solutions Are Reducing Emissions
Clean energy solutions like renewable sources of power and electric vehicles are taking hold in many locations around the world, and as a result, emissions are beginning to decline in these regions.
Clean power in India and China
In the past decade, China and India led the world in growth in power sector emissions. China's power sector emissions increased 53.7% between 2015 and 2024, while India's increased 34.6% in the same period. But last year, that rapid growth stalled. In 2025, China's power sector emissions fell 0.4%, the first time Climate TRACE data has shown a decline since the beginning of our inventory in 2015. India's power sector emissions fell for the first time since 2020, dropping 2.6% last year.
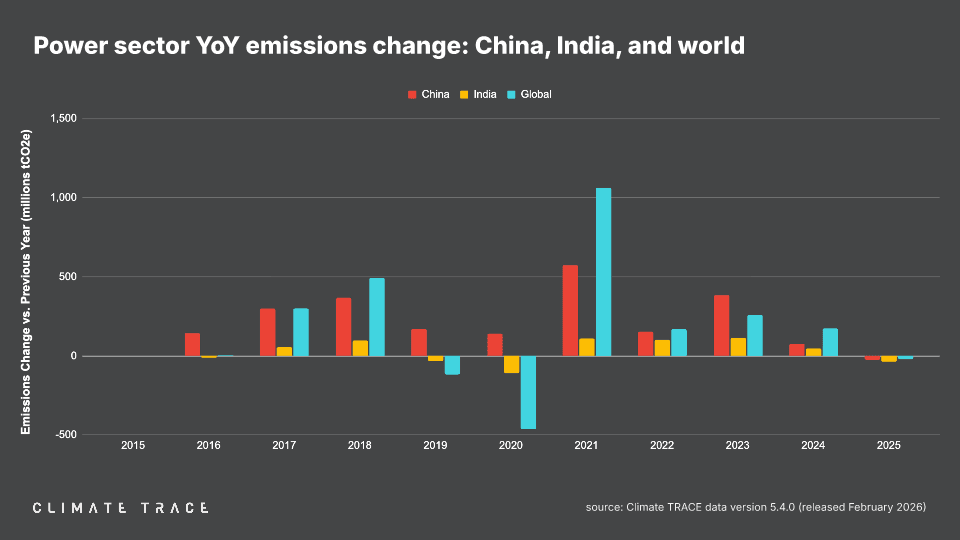
Crucially, both of these declines come at a time of increased economic growth and electricity consumption, demonstrating that renewable deployment is beginning to make a dent in overall power sector emissions in these countries.
EV adoption in Nordic countries
Globally, road transportation emissions have increased significantly over the past decade, but that is not the case in the Nordic countries (Denmark, Finland, Iceland, Norway, and Sweden). Since 2015, road transportation emissions in the Nordics have declined by 6.2%, whereas road transportation emissions have increased 3.8% in the EU and 11.2% globally. This is likely because the Nordic nations have seen strong EV adoption over the past decade. On average, nearly 70% of new car sales in these countries are electric. In Norway, where EVs comprised 96% of new car sales in 2025, road transportation emissions have dropped by nearly 9% in the past decade and fell by 2% last year alone.
The Nordic countries also made significant progress in cleaner power alongside EV adoption, with electricity generation emissions declining by 55.9% since 2015, outpacing the EU's 44.8% reduction.
The Latest Monthly Data: December 2025 Highlights
Global greenhouse gas emissions for the month of December 2025 totaled 5.21 billion tonnes CO₂e. This represents a decrease of 0.05% vs. December 2024. Global methane emissions in December 2025 were 33.22 million tonnes CH₄, an increase of 0.02% vs. December 2024.
Data tables summarizing GHG and primary particulate matter (PM2.5) emissions totals by sector, country, and the top 100 urban areas for December 2025 are available for download here.
Greenhouse Gas Emissions by Country: December 2025
Climate TRACE's preliminary estimate of December 2025 emissions in China, the world's top emitting country, is 1.52 billion tonnes CO₂e, a decline of 9.25 million tonnes of CO₂e, or 0.60% vs. December 2024.
Of the other top five emitting countries:
- United States emissions declined by 1.33 million tonnes CO₂e, or 0.22% year over year;
- India emissions increased by 4.77 million tonnes CO₂e, or 1.34% year over year;
- Russia emissions increased by 0.93 million tonnes CO₂e, or 0.33% year over year;
- Indonesia emissions increased by 0.52 million tonnes CO₂e, or 0.41% year over year.
In the EU, which as a bloc would be the fourth largest source of emissions in December 2025, emissions declined by 5.27 million tonnes CO₂e compared to December 2024, or 1.59%.
Greenhouse Gas Emissions by Sector: December 2025
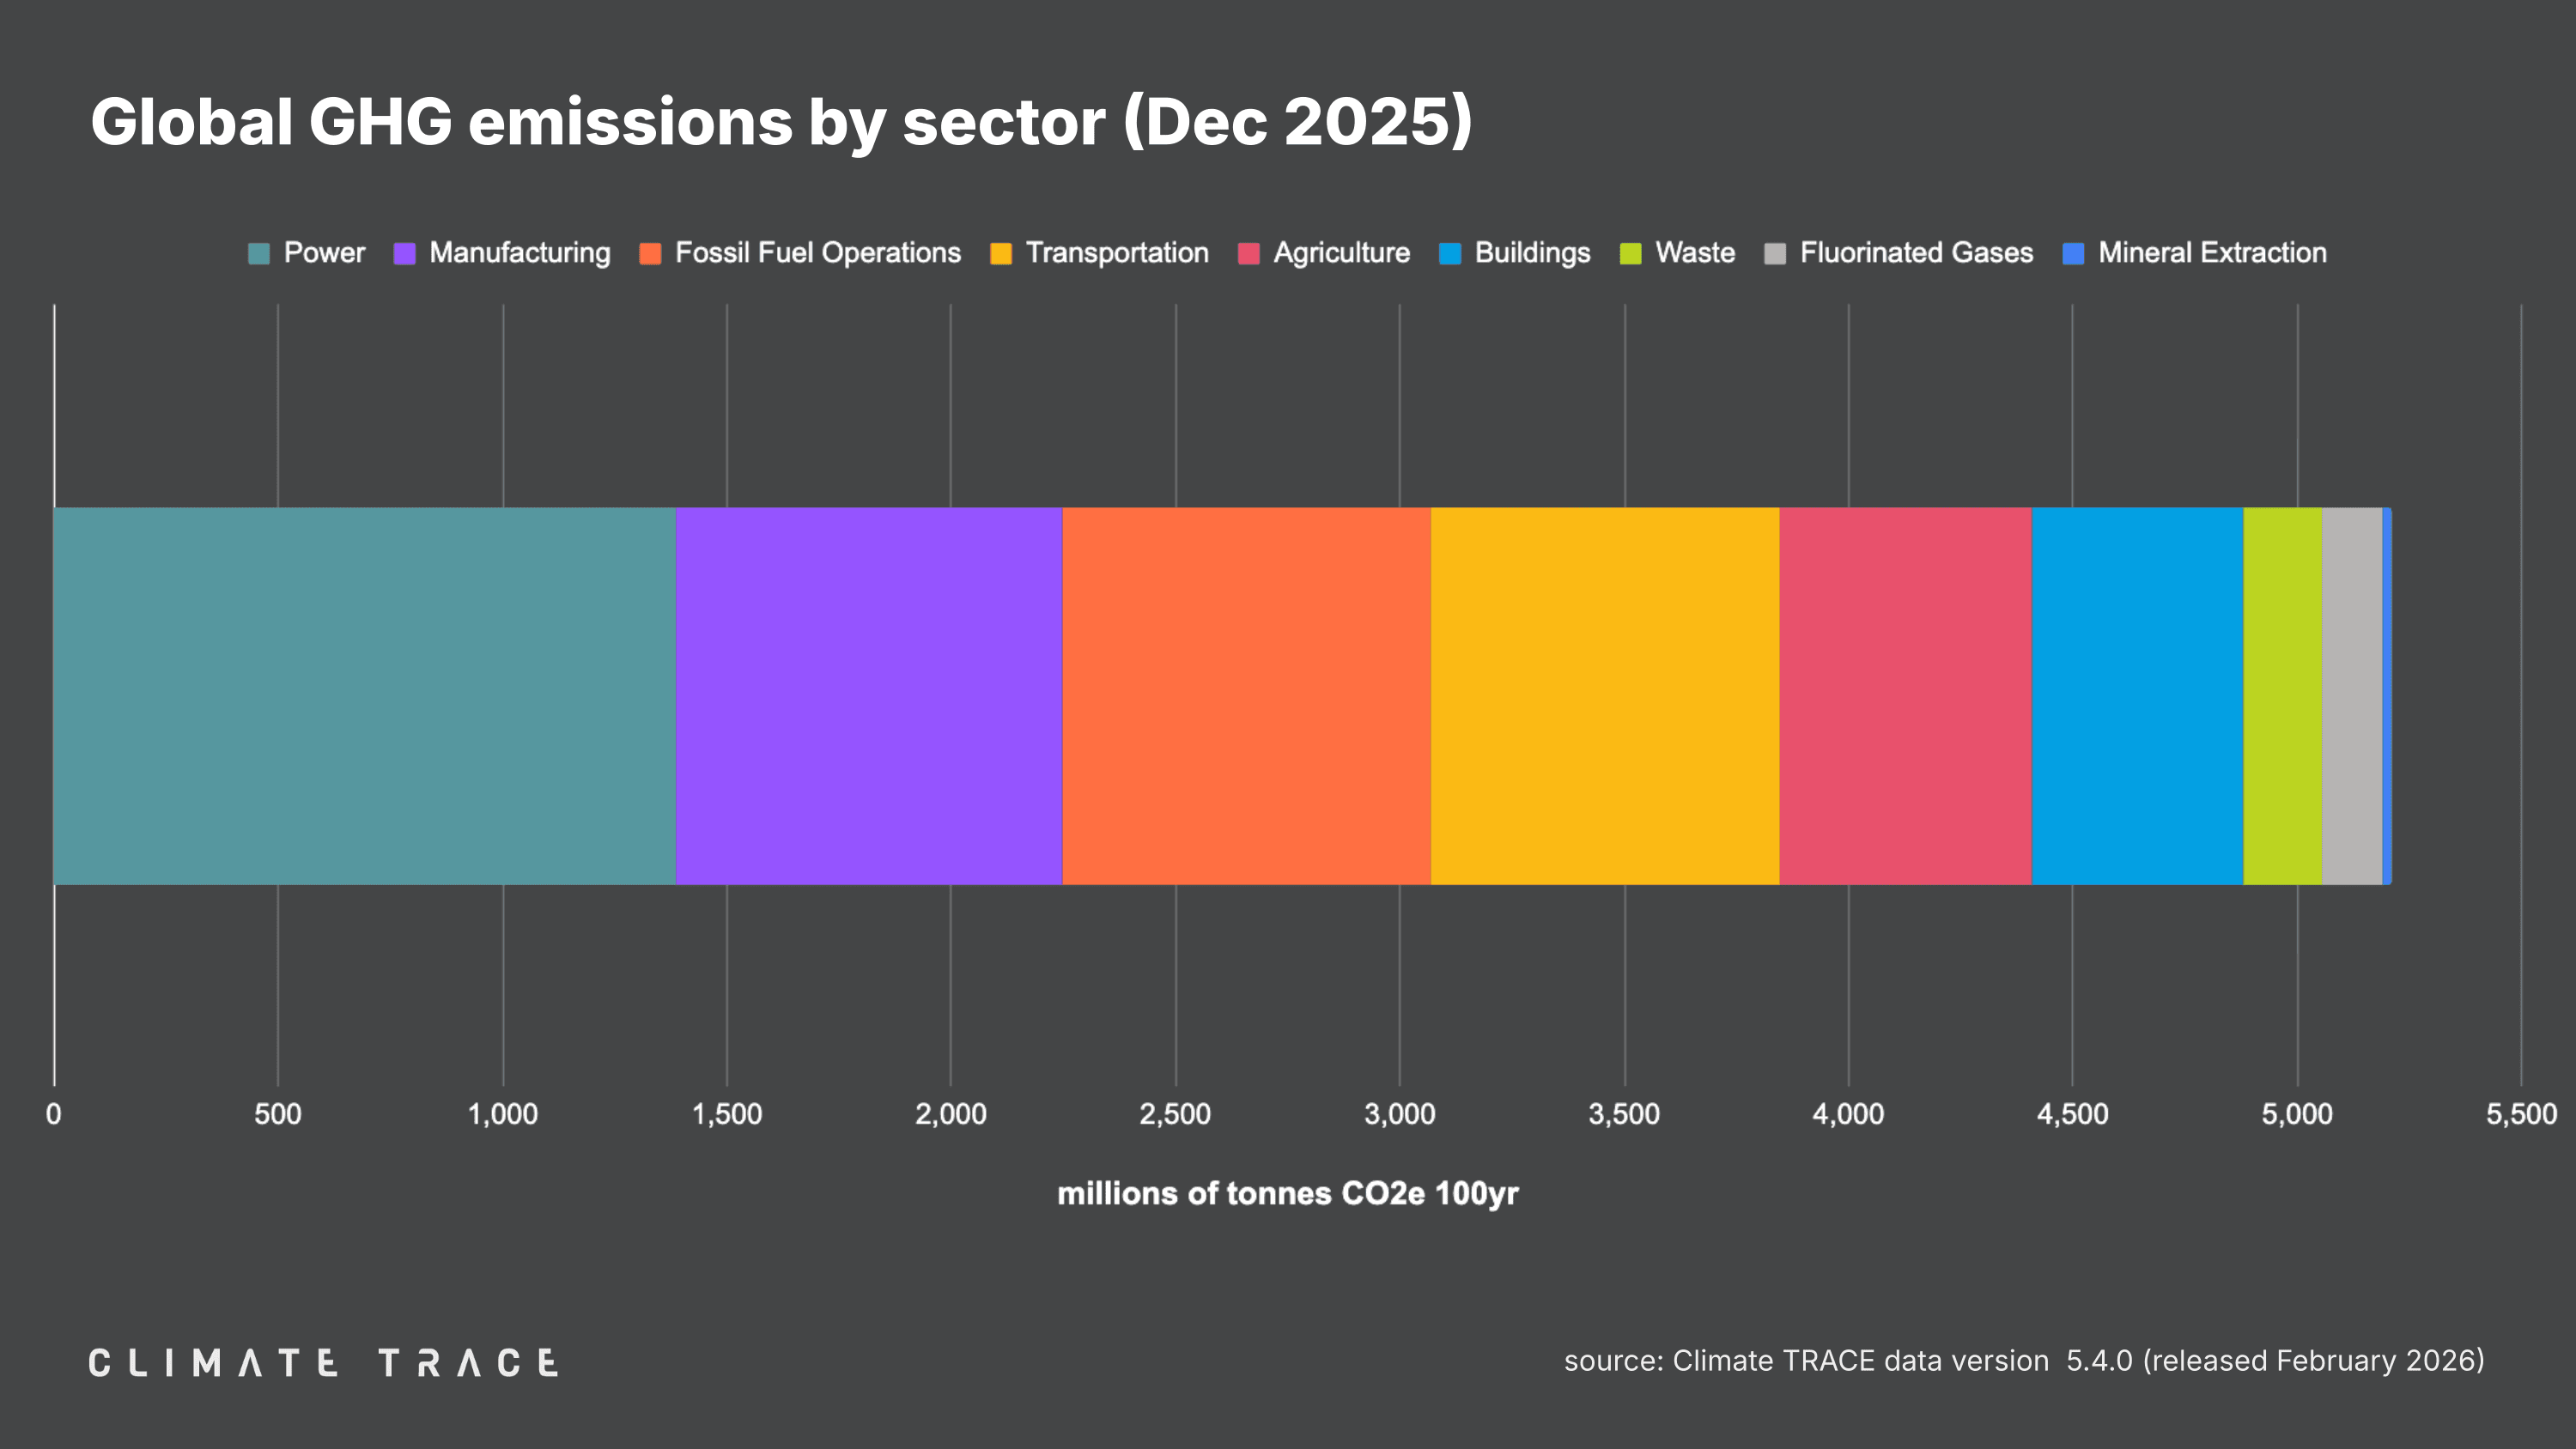
Greenhouse gas emissions increased in December 2025 vs. December 2024 in power, transportation, and waste, and decreased in agriculture, buildings, fossil fuel operations, and manufacturing. Buildings saw the greatest change in emissions year over year, with emissions decreasing by 2.14% as compared to December 2024.
- Agriculture emissions were 561.87 million tonnes CO₂e, a 0.05% decrease vs. December 2024;
- Buildings emissions were 469.88 million tonnes CO₂e, a 2.14% decrease vs. December 2024;
- Fluorinated gases emissions were 137.71 million tonnes CO₂e, unchanged vs. December 2024;
- Fossil fuel operations emissions were 822.92 million tonnes CO₂e, a 0.01% decrease vs. December 2024;
- Manufacturing emissions were 857.74 million tonnes CO₂e, a 0.05% decrease vs. December 2024;
- Mineral extraction emissions were 18.71 million tonnes CO₂e, unchanged vs. December 2024;
- Power emissions were 1,388.60 million tonnes CO₂e, a 0.22% increase vs. December 2024;
- Transportation emissions were 777.39 million tonnes CO₂e, a 0.60% increase vs. December 2024;
- Waste emissions were 174.40 million tonnes CO₂e, a 0.52% increase vs. December 2024.
Greenhouse Gas Emissions by City: December 2025
The urban areas with the highest total GHG emissions in December 2025 were Shanghai, China; Tokyo, Japan; New York, United States; Houston, United States; and Los Angeles, United States.
The urban areas with the greatest increases in absolute emissions in December 2025 as compared to December 2024 were Doha, Qatar; Dubai, United Arab Emirates; Melbourne, Australia; Moscow, Russia; and Chicago, United States. Those with the largest absolute emissions declines between this December and last December were Seoul, South Korea; Santos, Brazil; Shanghai, China; Manama, Bahrain; and Busan, South Korea.
The urban areas with the greatest increases in emissions as a percentage of their total emissions were Butibori, India; Uruguaiana, Brazil; Yamunanagar, India; Bata, Equatorial Guinea; and Al Khor, Qatar. Those with the greatest decreases by percentage were Monclova, México; Tanjung Pandan, Indonesia; Mariupol, Ukraine; Mettur, India; and Savona, Italy.
RELEASE NOTES
With the addition of December 2025 data, the Climate TRACE database is now updated to version 5.4.0. In this release, the cattle operations sectors added coverage for 2,051 assets in Turkey and Korea and updated assets in Brazil. Asset coverage also expanded with 11 new solid-waste disposal sites, aviation with seven new sources, and domestic wastewater with 1,989 new assets. A detailed description of data updates is available in our changelog here. A known issue in the oil and gas transportation sector at the city level will be patched in version 5.4.1.
To learn more about what is included in our monthly data releases and for frequently asked questions, click here. All methodologies for Climate TRACE data estimates are available to view and download here. For any further technical questions about data updates, please contact: coalition@ClimateTRACE.org.
To sign up for monthly updates from Climate TRACE, click here.
Emissions data for January 2026 is scheduled for release on March 26, 2026.
About Climate TRACE The Climate TRACE coalition was formed by a group of AI specialists, data scientists, researchers, and nongovernmental organizations. Current members include Carbon Yield; Carnegie Mellon University's CREATE Lab; CTrees; Duke University's Nicholas Institute for Energy, Environment & Sustainability; Earth Genome; Former Vice President Al Gore; Global Energy Monitor; Global Fishing Watch/emLab; Johns Hopkins University Applied Physics Lab; OceanMind; RMI; TransitionZero; and WattTime. Climate TRACE is also supported by more than 100 other contributing organizations and researchers, including key data and analysis contributors: Arboretica, Michigan State University, Ode Partners, Open Supply Hub, Saint Louis University's Remote Sensing Lab, and University of Malaysia Terengganu. For more information about the coalition and a list of contributors, click here.
Media Contacts Fae Jencks and Nikki Arnone for Climate TRACE