Conversations With the Coalition: Jeremy Freeman

As part of an ongoing Climate TRACE series, we are interviewing individual coalition members about their work. We recently caught up with Jeremy Freeman, Head of Research & Engineering, GEMS, at environmental tech nonprofit WattTime.
Which emissions sector do you focus on, and why?
At WattTime we focus on emissions from electricity-generating power plants for the coalition, using satellite data to monitor power plant pollution around the world, including in countries where these data are not available publicly.
Electricity generation is one of the highest contributing sectors to global greenhouse gas emissions. Our hope is that, through increased transparency about what's going on both globally and down to an asset level of individual power plants, we can start to unlock different theories of change to help decarbonize the globe, and electric power in particular.
Where are you in the process of capturing these data?
In 2021, we released countrywide estimates for emissions from the electric power production sector for nearly all the countries in the world. Last year, we continued that analysis and then provided asset-level information for the top 500 emitting power plants.
This year, we are working to increase our coverage for asset-level emissions down to all major power plants globally. It won't be every last power plant, but together the assets we report on will account for more than 90% of greenhouse gas emissions from electric power.
For each of these power plants, we'll have asset-level information about where the plant is located, who owns it, what type of fuel it burns, and the capacity, generation, and greenhouse gas emissions associated with it.
What is your overall approach to collecting these emissions data?
First, we needed to develop a catalog of all the power plants and their locations. For this we rely on several sources, including partners and other coalition members such as Global Energy Monitor.
With an understanding of where power plants are in the world, we investigate which satellites can view the power plants and what outward, observable signs of emissions-causing activity can be seen from space with those satellites
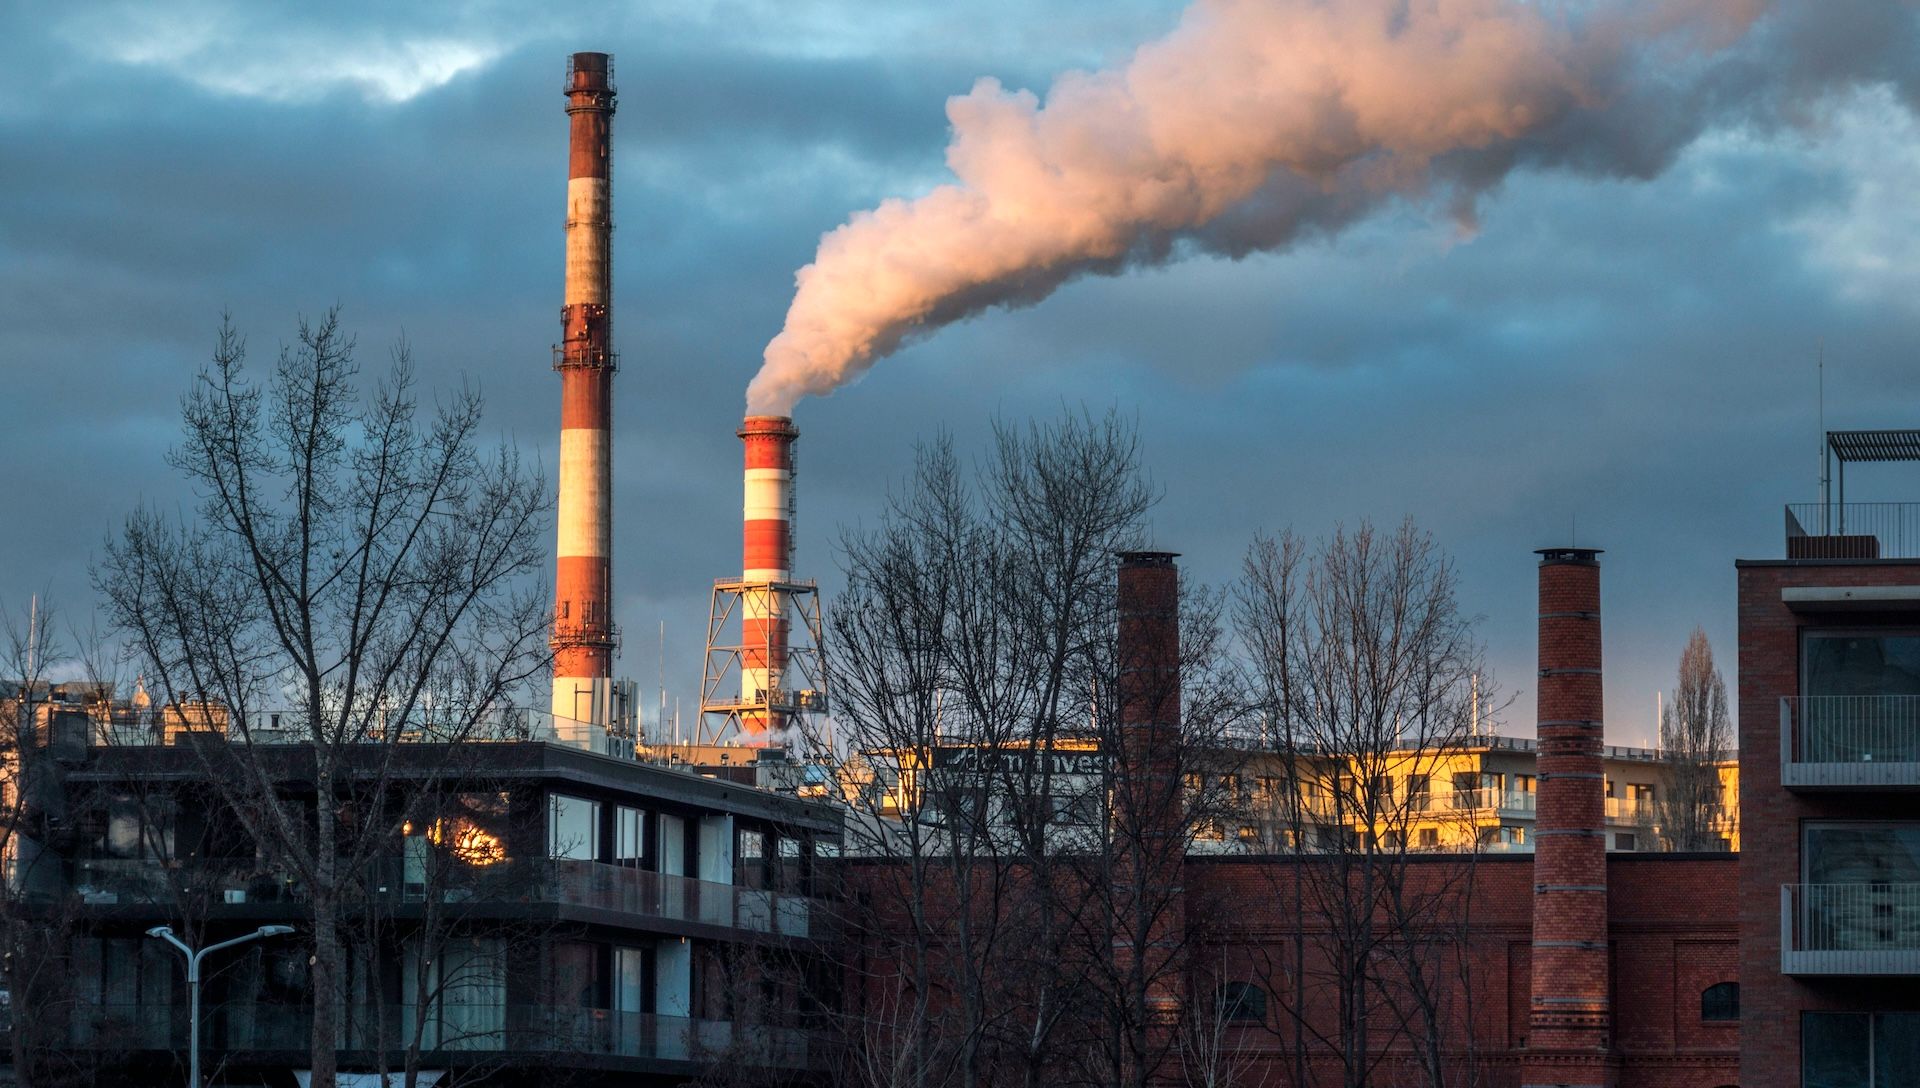
One of the most prominent signals comes from large boilers in particular. When they're burning fuels to make power, only 30–40% of the energy of the fuel is turned into electric power; most of the rest has to be exhausted as waste heat. Some of the giant cooling systems used to manage this process use evaporative cooling and give off a white plume of water vapor that is visible from space.
Another signal for coal power plants is that when you're burning coal, other emissions exist such as sulfur dioxide, which can cause acid rain, nitrous oxide, and smog. In many parts of the world, these plants are required to operate a flue gas desulfurization scrubber that reduces the sulfur emitted into the atmosphere. A subset of those systems give off a vapor plume coming out of the stack that is also visible from satellites.
We also bring in ground-based plant generation data available in the U.S., Australia, and Europe to train our machine learning models, and use that to infer the plant generation and emissions for plants globally.
What challenges have you faced along the way, and how have you solved them?
Quite a few. Let’s start with the fact that power plants themselves are very heterogeneous. You can try to apply machine learning to all of them as if they were the same type, but you’d get unreliable predictions because different power plants have different signals that are visible from space. You need to build models specific to a particular type of power plant and its relationship between plant emissions and what is measured by the satellite sensor.
Cataloging power plants around the world has also taken a tremendous amount of work, because location data is often not publicly available and the need to link multiple datasets together to get a comprehensive dataset to train models with.
How can organizations use these data to support target setting and emissions reductions?
Right now, the project team is very focused on expanding our data from country-level power sector emissions and the top 500 most-emitting power plants in the world, to substantially all the major emitting power plants globally.
Those data will bring incredible new opportunities to get our collective hands around the problem of power plant emissions. Instead of looking at the overwhelming challenge of global greenhouse gas emissions and finding no clear place to start, these asset-level views represent a chance to distill that global view into a more actionable local and regional perspective.
For example, as countries look at retiring their fleets of coal-fired power plants and transitioning off of fossil-fueled electricity generation overall, and as companies consider where to invest in new renewable energy capacity, Climate TRACE power sector emissions data helps them identify the greatest specific opportunities.
Interviewed by Daisy Simmons.


